tag: gpu

Datoviz: ultra-fast GPU scientific visualization with Vulkan

2021-02-16

I'm excited to present the project I've been working on at the International Brain Laboratory (IBL). Datoviz is an early-stage open-source high-performance GPU scientific visualization library based on Vulkan, the Khronos cross-platform low-level graphics API, which is 5 years old today!

Datoviz screenshots

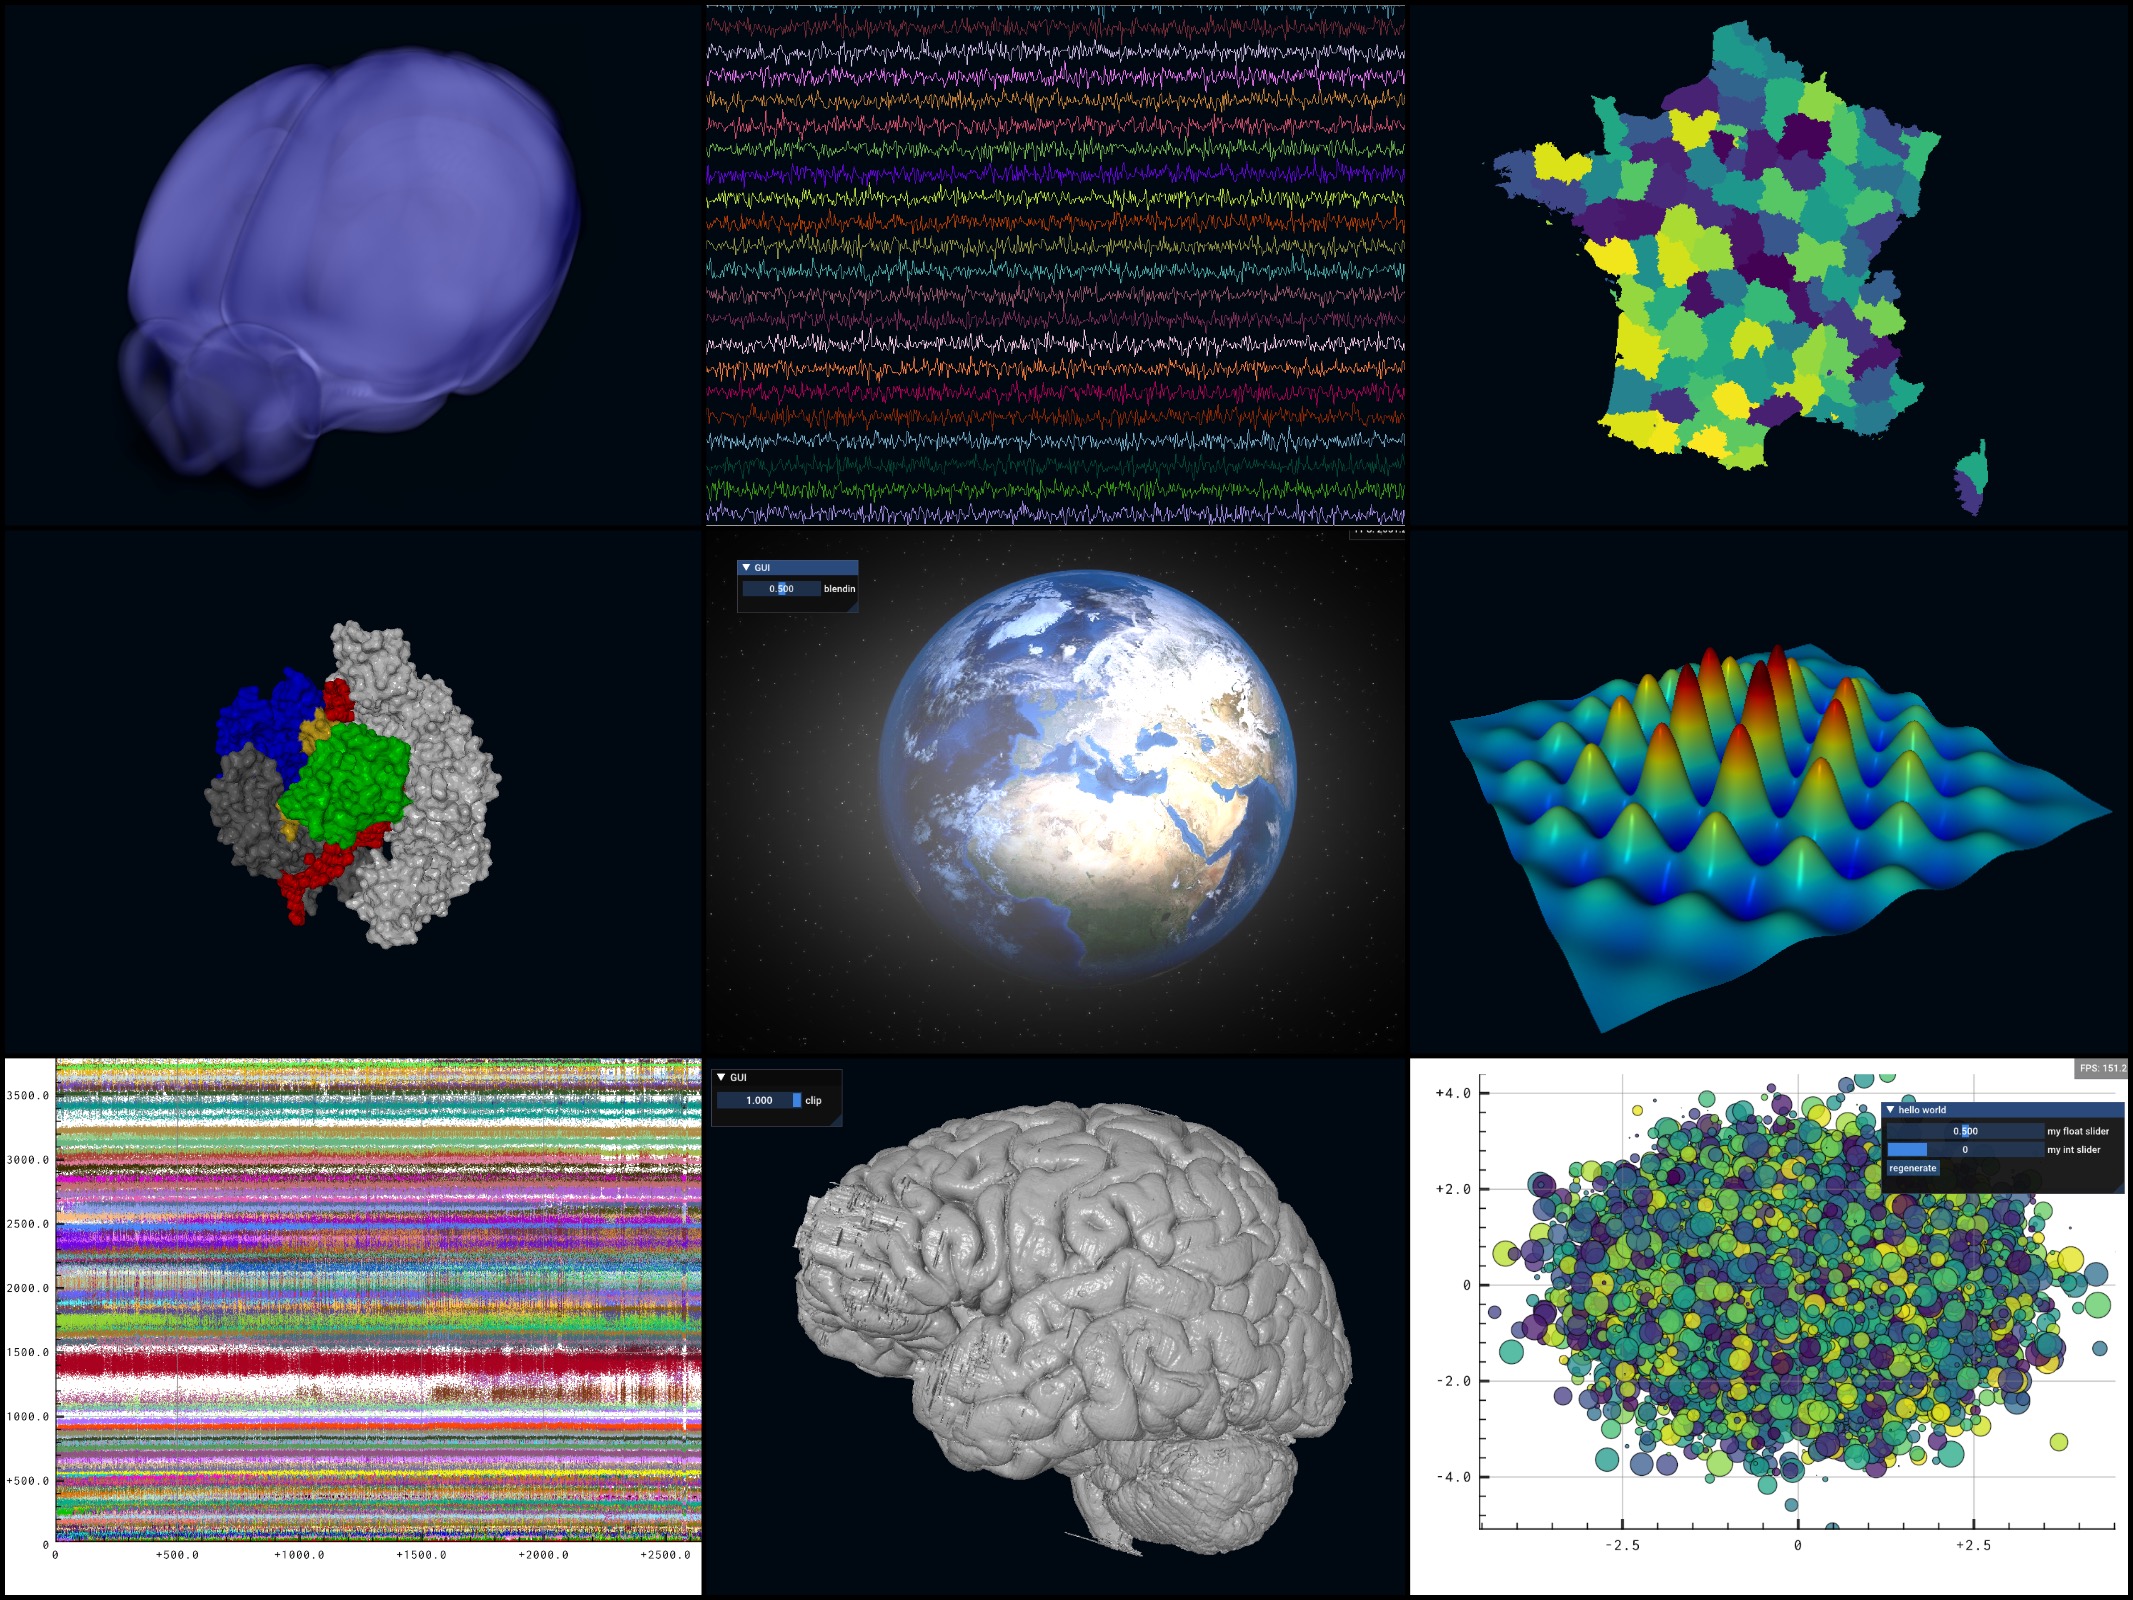
Datoviz aims at providing a unified, language-agnostic platform for interactive visualization in both 2D and 3D, with support for GUIs and general-purpose GPU compute.


A compiler infrastructure for data visualization

2015-07-24

There are many data visualization tools out there. Yet, I believe we're still lacking a robust, scalable, and cross-platform visualization toolkit that can handle today's massive datasets.

Most existing tools target simple plots with a few hundreds or thousands of points: bar plots, scatter plots, histograms and the like. Typically, these figures represent aggregated statistical quantities. Maps are also particularly popular, and there are now really great open source tools.

Perhaps contrary to a common belief, this is not the end of the story. There are much more complex visualization needs in academia and industry, and I've always been unsatisfied by the tools at our disposal.


Big Data visualization with WebGL, part 2: VisPy

2014-12-11

In this post series, I'm describing the big data visualization platform I'm currently developing with WebGL. I'll detail in this second post the VisPy library which is the basis of the project.


Big Data visualization with WebGL, part 1: Overview

2014-10-15

In this post series, I'll talk about the big data visualization platform I'm currently developing with WebGL. I'll give in this first post the main motivations for this project. The next posts will contain the technical details.


Hardware-accelerated interactive data visualization in Python

2013-04-04

There have been several interesting discussions recently about the future of visualization in Python. Jake Vanderplas wrote a detailled post about the current state-of-the-art of visualization software in Python. Michael Droettboom, one of the Matplotlib's core developers, consequently wrote about the future challenges Matplotlib will need to tackle. Matplotlib has been designed more than ten years ago, and now needs to embrace modern trends including web frontends, high-level R-style plotting interfaces, hardware-accelerated visualization, etc.