Datoviz: ultra-fast GPU scientific visualization with Vulkan
I'm excited to present the project I've been working on at the International Brain Laboratory (IBL). Datoviz is an early-stage open-source high-performance GPU scientific visualization library based on Vulkan, the Khronos cross-platform low-level graphics API, which is 5 years old today!
Datoviz aims at providing a unified, language-agnostic platform for interactive visualization in both 2D and 3D, with support for GUIs and general-purpose GPU compute.
The main novelties compared to existing open source visualization solutions are:
- performance,
- portability across languages (not just Python or another specific language),
- ability to support simultaneously 2D, 3D, GUIs and general-purpose GPU computing in the same interface.
This new technology allows for a level of performance probably unprecedented in scientific 2D/3D visualization applications. For example, on a 2019 high-end NVIDIA GPU:
- a simple scatter plot with 10 million points renders at 250 FPS,
- a high-resolution 3D mesh with 10 million triangles renders at 400 FPS,
- one thousand signals with 30,000 points each (30M vertices) renders at 200 FPS
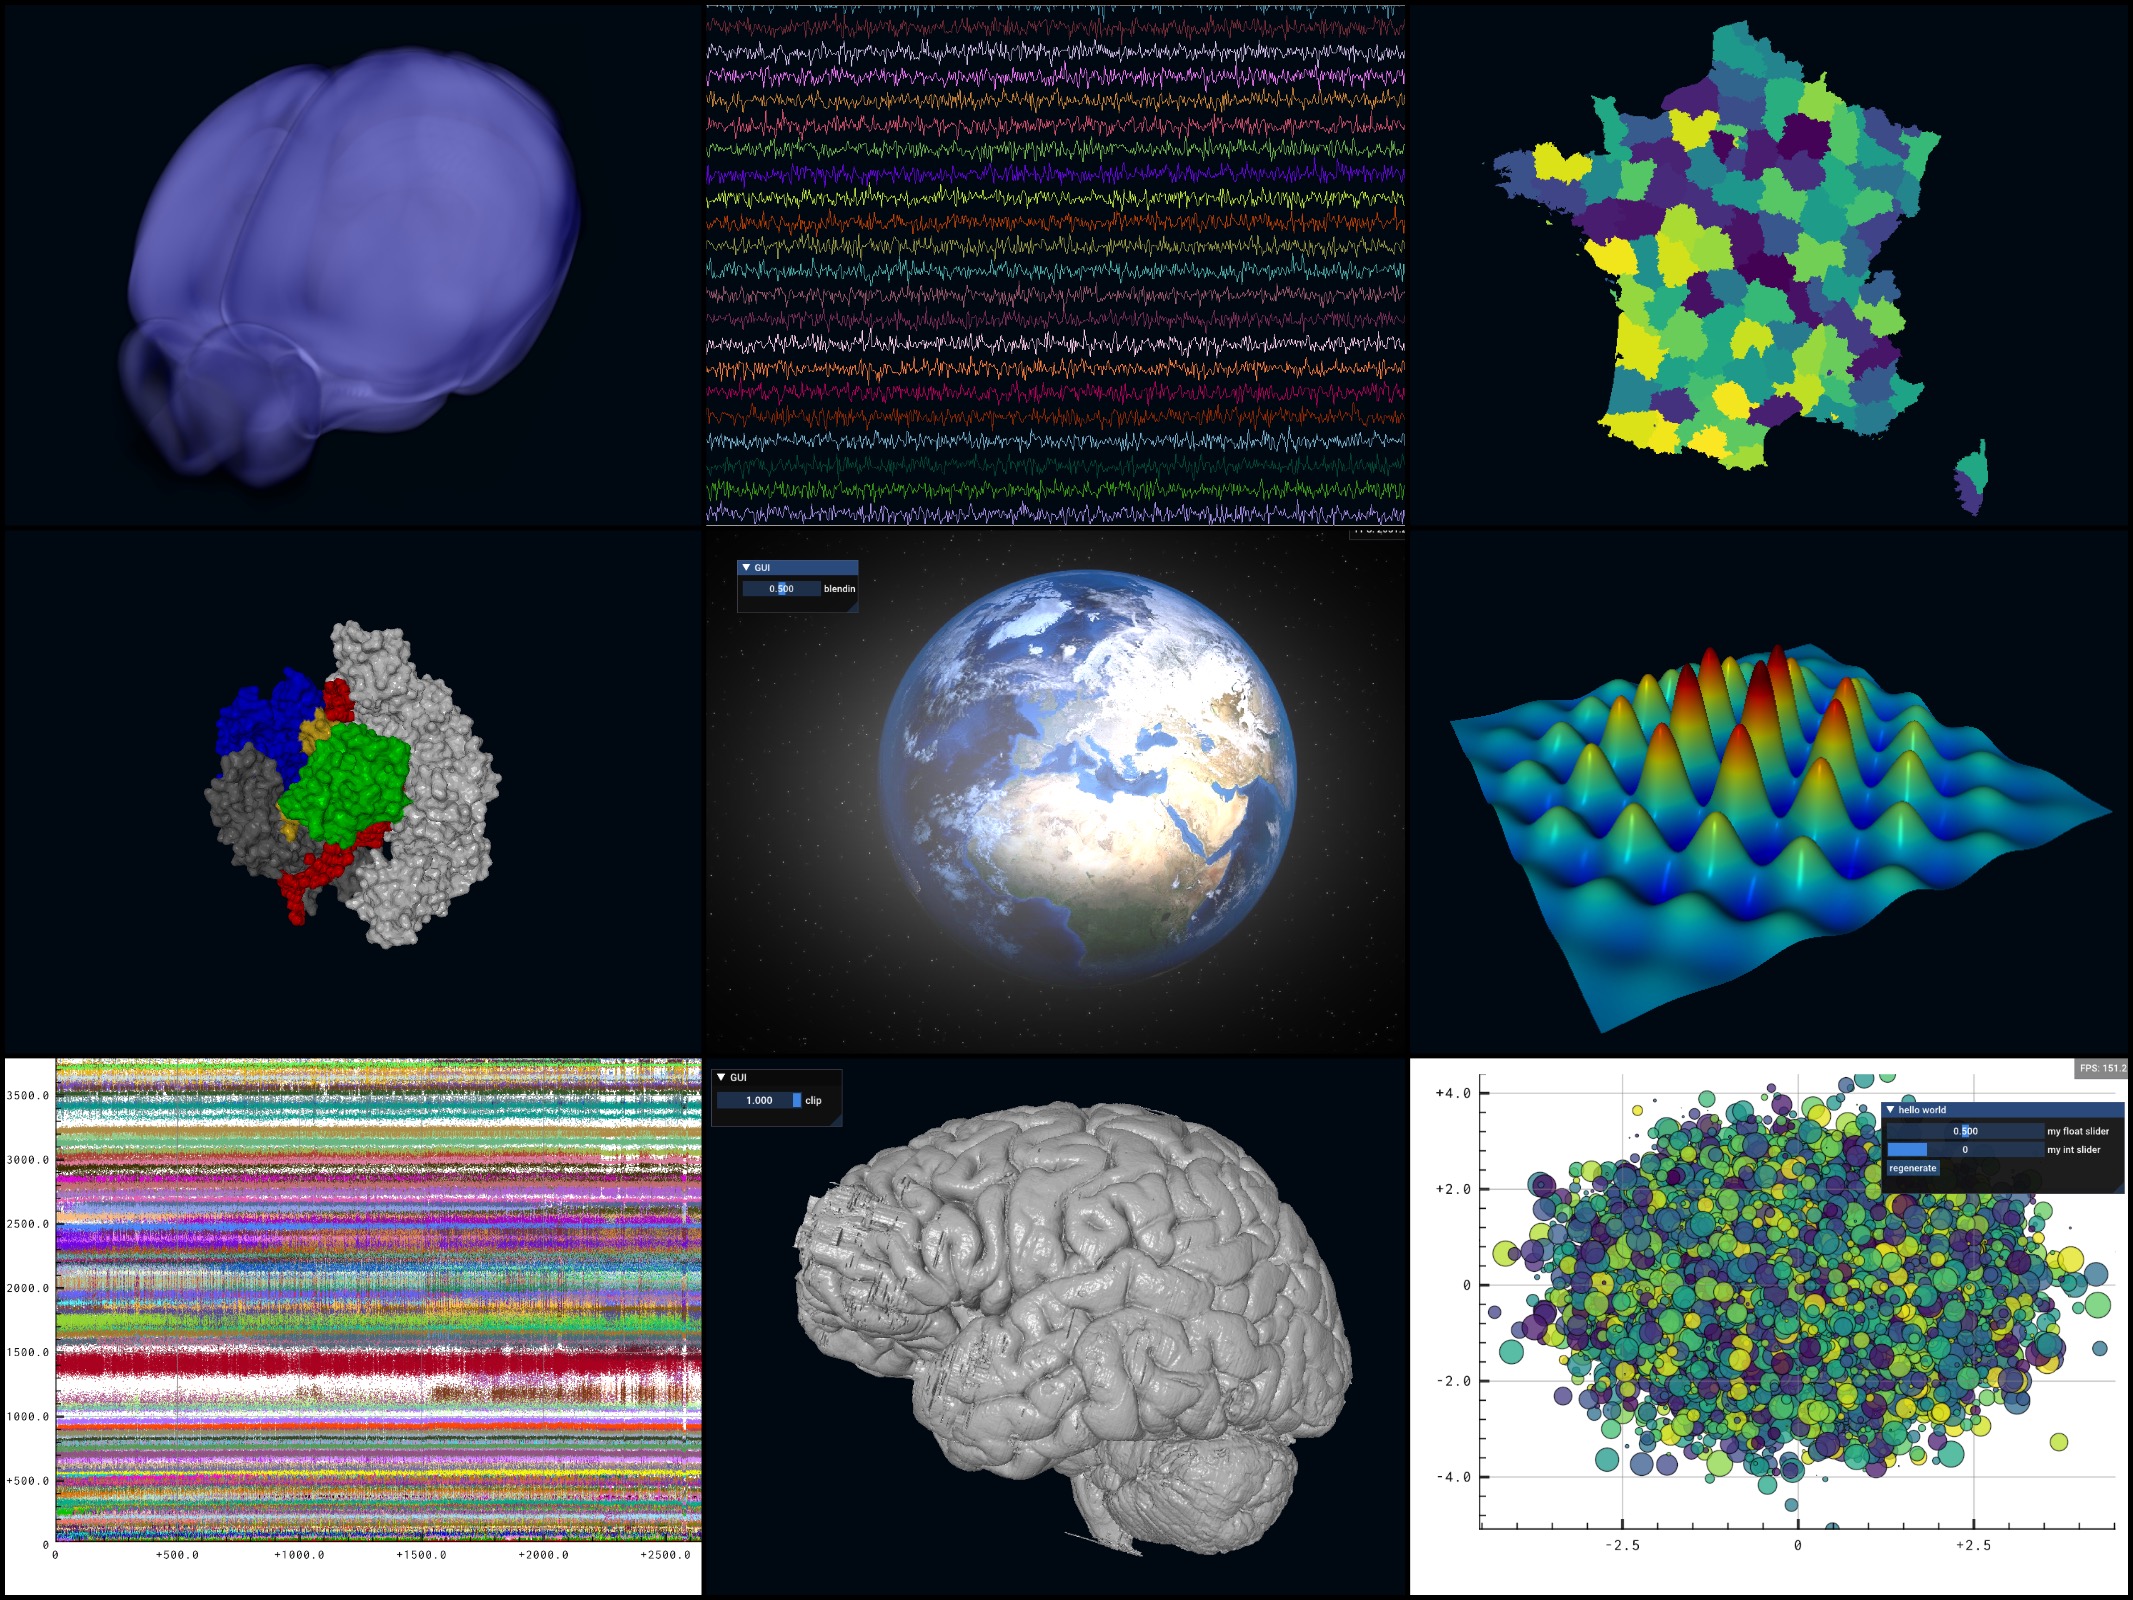
We're starting to use Datoviz at IBL for graphical exploration of the large amounts of data we're acquiring: high-density electrophysiological data, neural activity in the 3D brain volume, and much more to come.
Datoviz is entirely written in C on top of the Vulkan C API. There are preliminary light Python bindings (Cython). There are no external dependencies for the GUIs, everything is already bundled into the library (Dear ImGui).
A short history of the project
This project is the culmination of a decade of personal interests, research, and development in this field. Frustrated by the poor performance of existing visualization libraries, I started to investigate using the GPU for fast 2D visualization in 2011. I released the experimental Galry project in 2012.
The next year, I was approached by other Python developers who each had created their own library. We decided to join forces to create a single library, VisPy, in 2013. Today, VisPy is maintained by David Hoese and others. It got recent funding from the Chan Zuckerberg Initiative. VisPy underlies napari, a popular imaging software developed by Nicholas Sofroniew et al.
Based on Python and OpenGL, VisPy is a very complex piece of software, in large part because of the quirks and limitations of OpenGL (especially when it's used from Python). I felt we had reached the limits of this technology but then, OpenGL's successor was announced: Vulkan.
I was very excited by this announcement and thought it could be a perfect technology for the next generation of GPU visualization software. In 2015, before the API was even released, I wrote a blog post with a few ideas in this respect. It took me more nearly four years after the release of Vulkan in 2016 to find the time to experiment with it.
Vulkan for scientific visualization
Vulkan is a great technology for modern scientific visualization. Of course, that conclusion probably applies to other low-level graphics APIs like Metal, DirectX 12, WebGPU which all share a lot of principles (I have no experience with those — but WebGPU looks so promising). It's worth nothing that Khronos and the industry are starting to work in this direction too with the ANARI project.
The complexity of Vulkan is probably well beyond what about any scientist might want to deal with. In the last few years, I regularly tried to read tutorials and specifications but it seemed daunting and impenetrable. Eventually, I started to connect the dots.
The point of a library like Datoviz is precisely to hide most of that complexity away to scientist end-users. It's like a game engine, but for scientific visualization. The top-level API deals with visual elements rather than GPU objects and abstractions (which nevertheless remain accessible to advanced users).
Conceptually, most interactive scientific visualization use-cases are rather simple: define a subplot layout, choose a set of predefined visual elements (markers, paths, images, text, meshes...), interactivity models (2D pan/zoom, 3D arcball, first-person camera, etc.), and upload your data (positions, colors, colormaps, sizes...) in the coordinate system of your choice. More advanced use-cases essentially boil down to updating visuals and data as a response to events (mouse, keyboard, timers...).
The hard part is obviously in the underlying implementation that should efficiently leverage the GPU, and even more so in the richness of the built-in visuals. Relatively basic visual elements are provided right now, more will come soon.
Implementation
Datoviz already sustained several development cycles with extensive internal refactoring and rewrites as I was being more and more accustomed to the technology. The low-level foundations are now relatively solid. Implementing everything from the ground up in Datoviz allowed for more control of the entire visualization stack, making it more amenable to scientific applications, less reliant on third-party projects, and less prone to the various bugs in the OpenGL drivers that we were used to in VisPy.
The choice of C as a programming language results from pragmatic rather than ideological reasons. Given the requirements of the project (performance, portability, wrapping by other languages), the most serious contenders were C++ and Rust. I actually started using C++, but I realized that my knowledge of modern C++ was lacking and would have required significant learning efforts. I felt that writing good, production-quality C++ code required a lot of experience. I had even less experience with Rust, and learning both Vulkan and a new programming language at the same time required a bandwidth I didn't have. Since the Vulkan API is a C API, I ended up just using C. It is not impossible that some parts of the library end up being rewritten in another, less ancient language. Yet, in this project, I feel that C gets the job done quite nicely. The hard parts actually lie in the GLSL shaders (which is itself a dialect of C), and in the Vulkan wrapper which is now pretty stable.
Prior work
When developing Datoviz, I relied extensively on prior work. The experience we gained in developing VisPy was instrumental. A lot of ideas elaborated when creating VisPy made their way into Datoviz.
Nicolas Rougier, the creator of Glumpy, one of the initial core VisPy cofounders, and a well-known contributor to the matplotlib knowledge base (articles, tutorials, videos, books), has published papers in computer graphics journals about displaying high-quality 2D graphics on the GPU. I reused a lot of his GLSL code (originally implemented in Glumpy) in the shaders provided in Datoviz. He ported to the GPU algorithms initially implemented by the late Maxim Shemanarev, creator of the antigrain geometry C++ library.
Other dependencies (some of them are bundled into the library) non-exhaustively include GLFW, Dear ImGUI for GUIs, ffmpeg for making live screencasts, earcut for polygon triangulation, triangle for Delaunay triangulations, msdfgen for multi-channel signed distance field, used by the text visual.
Current status
My main goals now are to gather user feedback, fix bugs, improve the testing suite and continuous integration system, test the library on more hardware, work on packages, add a few more features until the first public release. Many more features are planned afterwards, which will mostly depend on our internal needs at the IBL. In the meantime, feel free to try the library if you feel adventurous.