tag: python

Writing the IPython Cookbook, Second Edition

2018-02-12
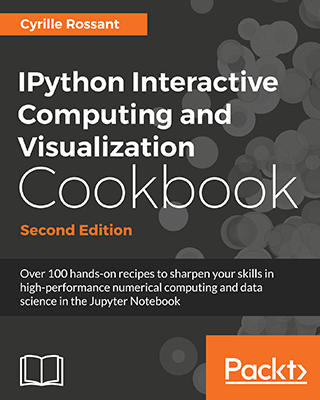
IPython Cookbook, Second Edition I'm pleased to announce the release of the IPython Cookbook, Second Edition, more than three years after the first edition. All 100+ recipes have been updated to the latest versions of Python, IPython, Jupyter, and all of the scientific packages.

There are a few new recipes introducing recent libraries such as Dask, Altair, and JupyterLab. As usual, all of the code is available on GitHub as Jupyter notebooks.

However, the main novelty is that almost the entire book is now freely available on GitHub. The released text is available under the CC-BY-NC-ND license, while the code is under the MIT license. A few recipes are exclusive to the printed book and ebook, to be purchased on Packt and Amazon.

The writing process was much less painful than with the first edition. In this post, I'll give an overview of the technical process I've used to write the book, using Markdown, Jupyter Notebook, pandoc, and pelican.


Setting up a blog with Pelican and GitHub Pages

2016-02-01

I describe how I set up my static blog/website in Python with Pelican, pandoc, Docker, Dockerhub, GitHub pages, and Travis CI.


Moving away from HDF5

2016-01-06

Update [2016-01-30]: I wrote a follow-up here

In the research lab where I work, we've been developing a data processing pipeline for several years. This includes not only a program but also a new file format based on HDF5 for a specific type of data. While the choice of HDF5 was looking compelling on paper, we found many issues with it. Recently, despite the high costs, we decided to abandon this format in our software.

In this post, I'll describe what is HDF5 and what are the issues that made us move away from it.


A compiler infrastructure for data visualization

2015-07-24

There are many data visualization tools out there. Yet, I believe we're still lacking a robust, scalable, and cross-platform visualization toolkit that can handle today's massive datasets.

Most existing tools target simple plots with a few hundreds or thousands of points: bar plots, scatter plots, histograms and the like. Typically, these figures represent aggregated statistical quantities. Maps are also particularly popular, and there are now really great open source tools.

Perhaps contrary to a common belief, this is not the end of the story. There are much more complex visualization needs in academia and industry, and I've always been unsatisfied by the tools at our disposal.


NumPy in the browser: proof of concept with Numba, LLVM, and emscripten

2015-02-18

It's been a while since I wanted to try to bring some of NumPy to the browser. I've already discussed the motivations for this in a previous post last year. As far as I'm concerned, the main use case would be to enable interactive data visualization in offline notebooks (including nbviewer), which often require client-based array operations for interactivity. In this post, I'll describe a proof-of-concept of compiling NumPy-aware Python functions to JavaScript using Numba, LLVM, and emscripten.