Open Data Hackathon: road accidents
I've participated at an Open Data hackathon organized by the French Minister of the Interior and several open data institutions. Together with Rue89 journalists and an OCTO Web developer, we created in two days an interactive map of all 62,000 road accidents in France in 2012. We used a very rich dataset released by the Minister of the Interior and Etalab.
Every road accident is timestamped and geolocated. The geolocation of many accidents was wrong in the original file, so we requested the help of a couple of developers highly experienced with geolocation. They were able to considerably improve the quality of the location of many accidents thanks to OpenStreetMap's BANO database.
There are many details per accident: gender and age of every person involved, severity of the wounds, seat belt worn or not, type and age of the vehicles, collision point on the vehicles, type of the road at the location of impact, climatic conditions, and many other details. In fact, the details are so precise that it may be possible to identify severe accidents by cross-checking with the local press.
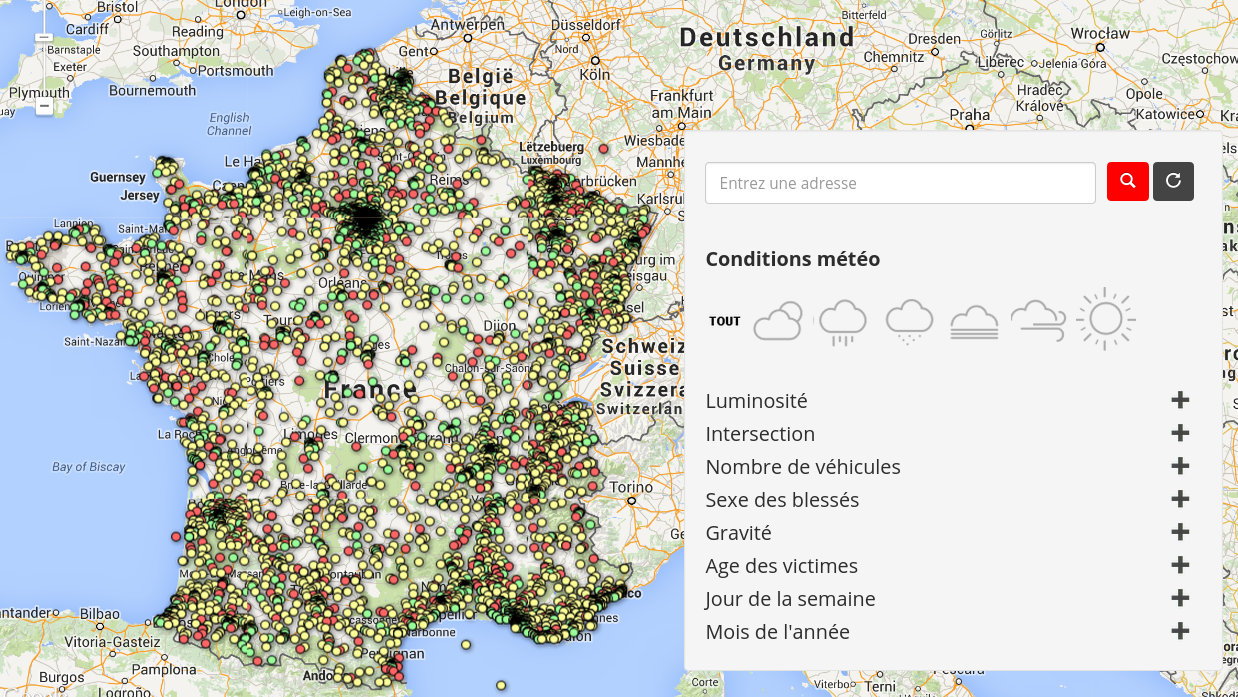
On our interactive map, one can click on each accident and get all the details available. One can also filter according to different criteria.
For the preparation of the data file, I used the IPython notebook, NumPy, and pandas. The original dataset consisted of four CSV files that had to be linked together using unique identifiers (like SQL tables). It is almost trivial to do that with pandas (join, merge, concatenate, etc.).
The main challenge was to mine the raw data and generate the user-friendly textual information that would appear on the map, regarding the climatic conditions, the type of the vehicles, and the details about the users. I was amazed about how easy it was to do that with pandas. I didn't have to use any for loop. Despite the dataset containing tens of thousands of data points, the data manipulations were very fast.
I may share later the notebooks that allowed me to do these data manipulations.
For the interactive map, we used Google Fusion Tables and Google Maps, because they were very easy to set up. I'd be interested in knowing open source alternatives that are almost as easy to use.